Whether you’re growing a personal channel or running a content strategy for your brand, one of the most important things you can do is track your YouTube view performance. Fortunately, YouTube provides powerful built-in analytics tools that help you understand what’s working — and what’s not.
In this guide, we’ll break down how to use YouTube Analytics to monitor your views, interpret essential metrics, and improve your video performance over time.
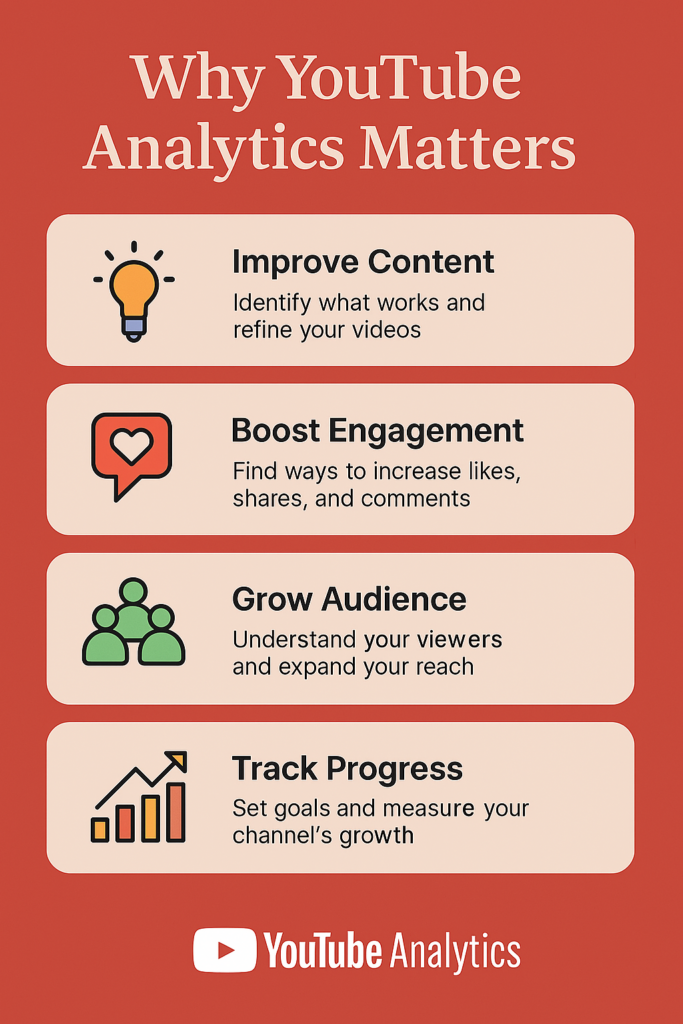
Why YouTube Analytics Matters
YouTube Analytics is more than just a vanity dashboard. It gives you real-time and historical insights into your channel’s performance, viewer behavior, and content impact. This allows you to:
- See which videos are driving the most engagement
- Understand how viewers discover your content
- Identify where and when viewers drop off
- Optimize future videos based on data-driven decisions
Tracking views isn’t just about the number — it’s about the quality and retention behind them.
Where to Find View Data in YouTube Analytics
To begin, head to YouTube Studio and navigate to the Analytics tab in the left-hand sidebar. Here’s where you’ll find:
➤ Overview Tab
- Views: Total views for the selected period
- Watch Time: Total minutes watched
- Subscribers: Gain or loss trends
- Top Videos: See which videos are performing best
➤ Content Tab
- Track views by content type: Shorts, Lives, and long-form
- Discover top-performing traffic sources
➤ Reach Tab
- Find out how your videos are being discovered: search, suggested videos, external traffic (like Reddit or blogs), and more
Key Metrics to Track View Performance
Here are the most important metrics to monitor if you want to truly understand how your videos are performing:
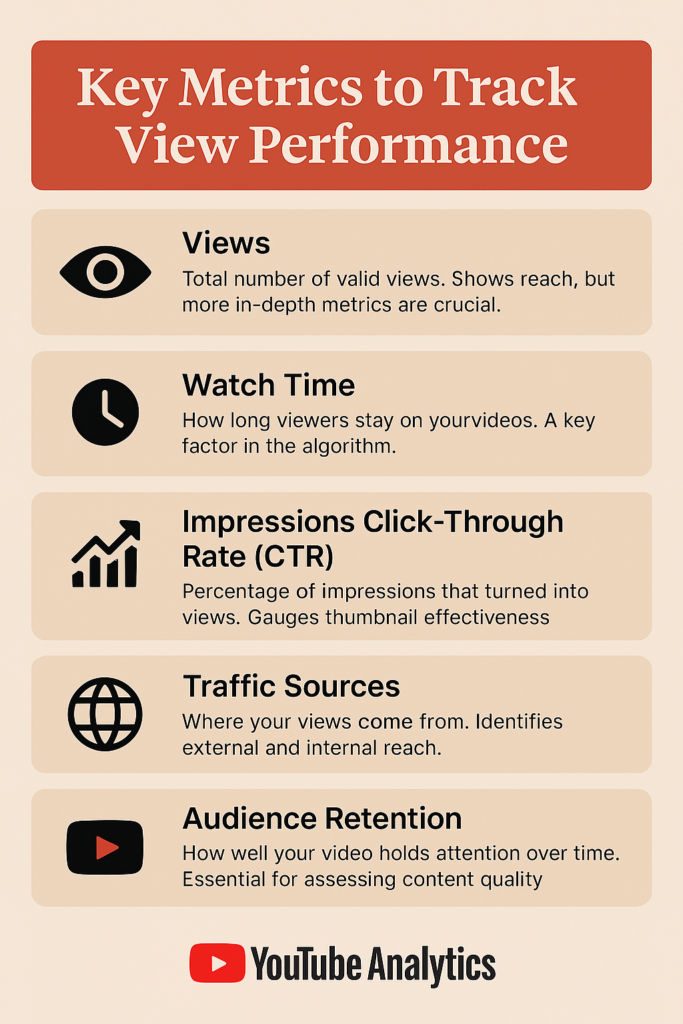
✅ Views
The total number of valid views your videos have received. Don’t focus only on this number — it’s just the starting point.
✅ Watch Time
Tracks how long viewers spend watching your content. Longer watch time helps your video rank better in YouTube’s algorithm.
✅ Average View Duration
Tells you how much of your video people are watching, on average. A higher AVD means better viewer retention.
✅ Click-Through Rate (CTR)
How often people click your video after seeing the thumbnail. Great for testing titles and thumbnails.
✅ Traffic Source
Reveals where your views are coming from — helpful for deciding where to promote your videos.
How to Use This Data to Improve Your Videos
YouTube Analytics isn’t just for review — it should directly influence your strategy. Here’s how:
- Low AVD? Consider making your intro more engaging or trimming unnecessary content.
- Low CTR? Test new thumbnails and titles.
- High drop-off rate at a specific time? Check what’s happening in the video and improve pacing or delivery.
- Top traffic source is external? Focus more promotion on that platform.
Bonus Tip: Combine Analytics with Smart Promotion
Using YouTube Analytics helps you optimize, but getting views in the first place is still crucial — especially when starting out.
To accelerate early growth and boost visibility, many creators choose to buy real, high-retention views. Our guide to buying YouTube views includes platforms that deliver safe, targeted views that positively influence watch time and improve organic performance over time.
Final Thoughts
YouTube Analytics is a powerful (and free) tool that can help you understand your audience, optimize your content, and grow your channel strategically. By focusing not just on view count but also on watch time, retention, and traffic sources, you’ll gain a clear edge in making content that performs.
Track regularly, analyze trends, and make informed adjustments — and you’ll build a channel that grows consistently over time.